OPEN INTEREST
Our trading strategy is built on a fundamental understanding that prices in the crypto market, especially for assets like Bitcoin, are heavily influenced by derivative exchanges. These exchanges sell leveraged positions to traders, which can magnify both potential profits and risks. At any given time, the value of derivatives can be 15-30 times the market cap of the actual asset, meaning the price movements are not purely driven by supply and demand but are strategically influenced by these exchanges.

Understanding Price Movements
Oscillations and Strategic Price Manipulation:
The price of an asset doesn't move in a straight line; it oscillates, reflecting both bullish and bearish phases. These oscillations occur at both micro and macro levels, much like a fractal pattern. Let's break down how this works in a bullish scenario:
Bullish Oscillation:
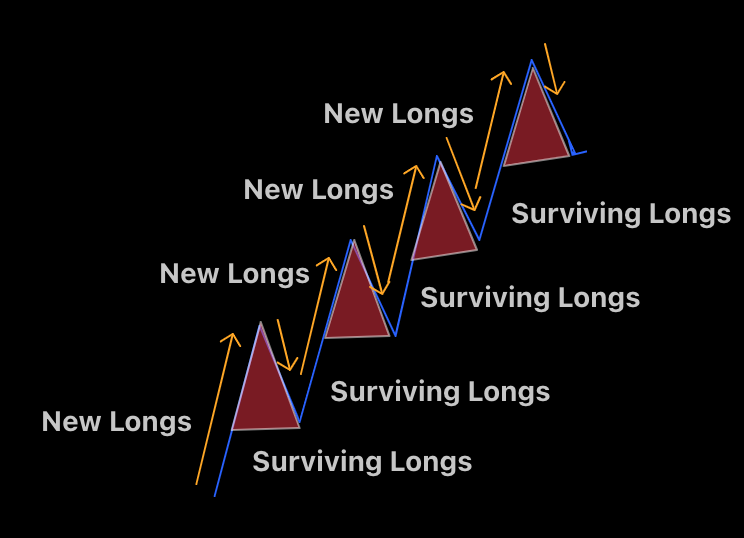
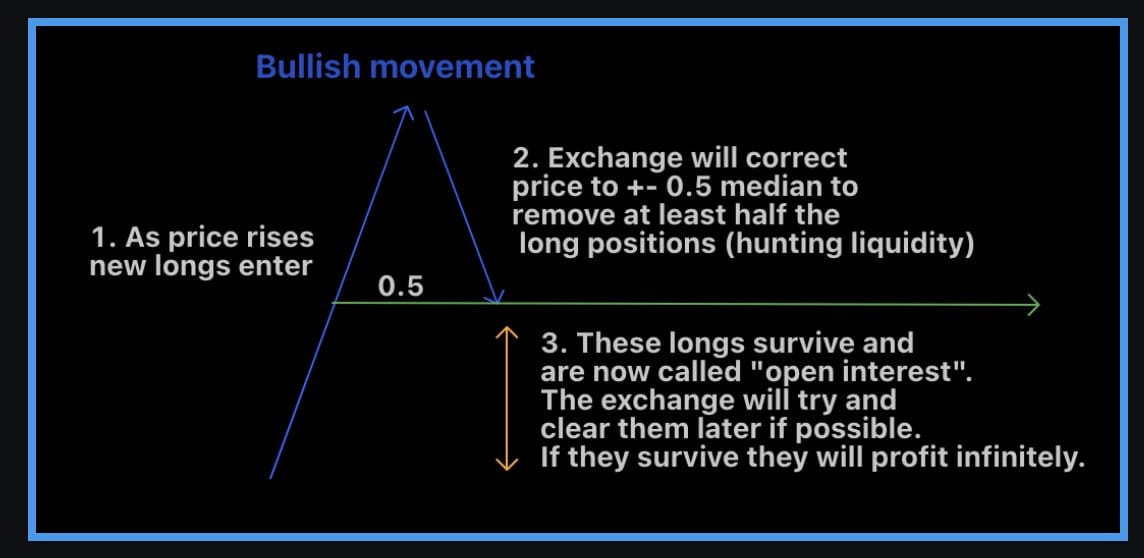
When traders open long positions and spot buyers purchase the asset, the price rises. This upward movement is driven by buying through limit orders or market orders on the order book.
However, once the price reaches a certain level, the exchange intervenes to prevent the price from rising indefinitely. It does this by initiating a bearish oscillation, which typically recovers about 50% of the previous bullish move. This is achieved by placing sell orders and leveraging traders' short positions. The exchange strategically "draws" the price chart to distribute risk and manage exposure.
Managing Open Interest:
The goal of the exchange is to limit the amount of "open interest," or active leveraged positions, that could potentially lead to large payouts if the price continues to rise. If a long position with leverage remains open, it poses a risk to the exchange because it could result in infinite profits as the price climbs. To mitigate this risk, the exchange orchestrates a continuous cycle of bullish oscillations followed by liquidation hunts. These liquidation hunts are designed to trigger stop losses or cause full liquidations, effectively "claiming" the liquidity from traders'.

The Basic Oscillation Strategy
As long positions accumulate, the price appreciates. When the price reaches a level deemed significant by the exchange's algorithms, the exchange will initiate a "flush." This involves dropping the price approximately halfway from the start of the oscillation, often down to the Fibonacci 0.5 level or median.
Traders who survive this flush hold "open interest" positions, which either allow them to realize profits or expose them to further risk in the next oscillation.
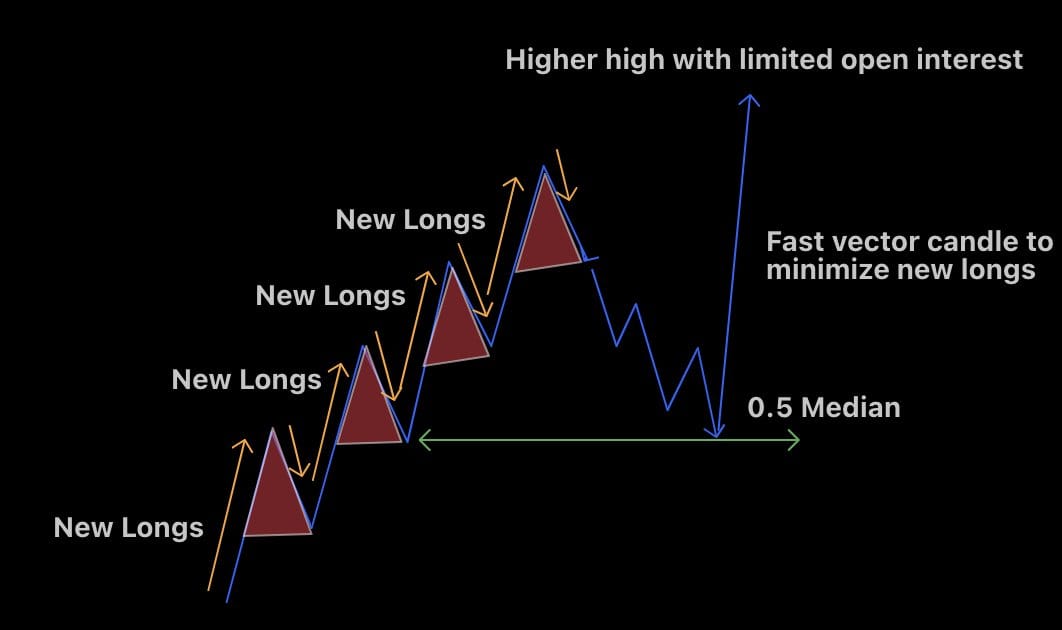
As the bullish trend continues and more traders survive the flush, the exchange may trigger a larger macro oscillation. At this stage, the exchange attempts to flush out as many of these open positions as possible. Theoretically, around 50% of the positions that drove the price up will remain open at this point.
The exchange then uses the order book to manipulate traders into adding to their positions, moving their stop losses, or opening new longs, all while preparing for another flush that will recover about 50% of the move but on a larger scale.
After completing the flush, the exchange may use a vector candle—a large, fast-moving price movement—to recover the price to where it started the flush. This is done to limit the number of new long positions being opened, as a slower price climb would accumulate more open interest, increasing the exchange's risk.

Bearish Oscillations
The same principles apply in bearish movements, but in reverse. Short positions drive the price down, and the exchange manages this by triggering bullish oscillations to recover some of the price drop, using the same Fibonacci-based strategies to manage their exposure.
Take Note
This strategy highlights how exchanges maximize their profits by controlling price movements and manipulating traders into positions that are likely to be liquidated. By understanding these oscillation patterns and the exchange's tactics, traders can better anticipate market movements and potentially avoid falling victim to these liquidity hunts. Given how derivative exchanges influence price movements through oscillations, flushes, and liquidity hunts, we can refactor the Pine Script to better align with these concepts. Our script will focus on detecting these strategic movements—particularly the oscillations and flushes—so that you can better anticipate potential price reversals and set up trades accordingly.
Refactored Pine Script
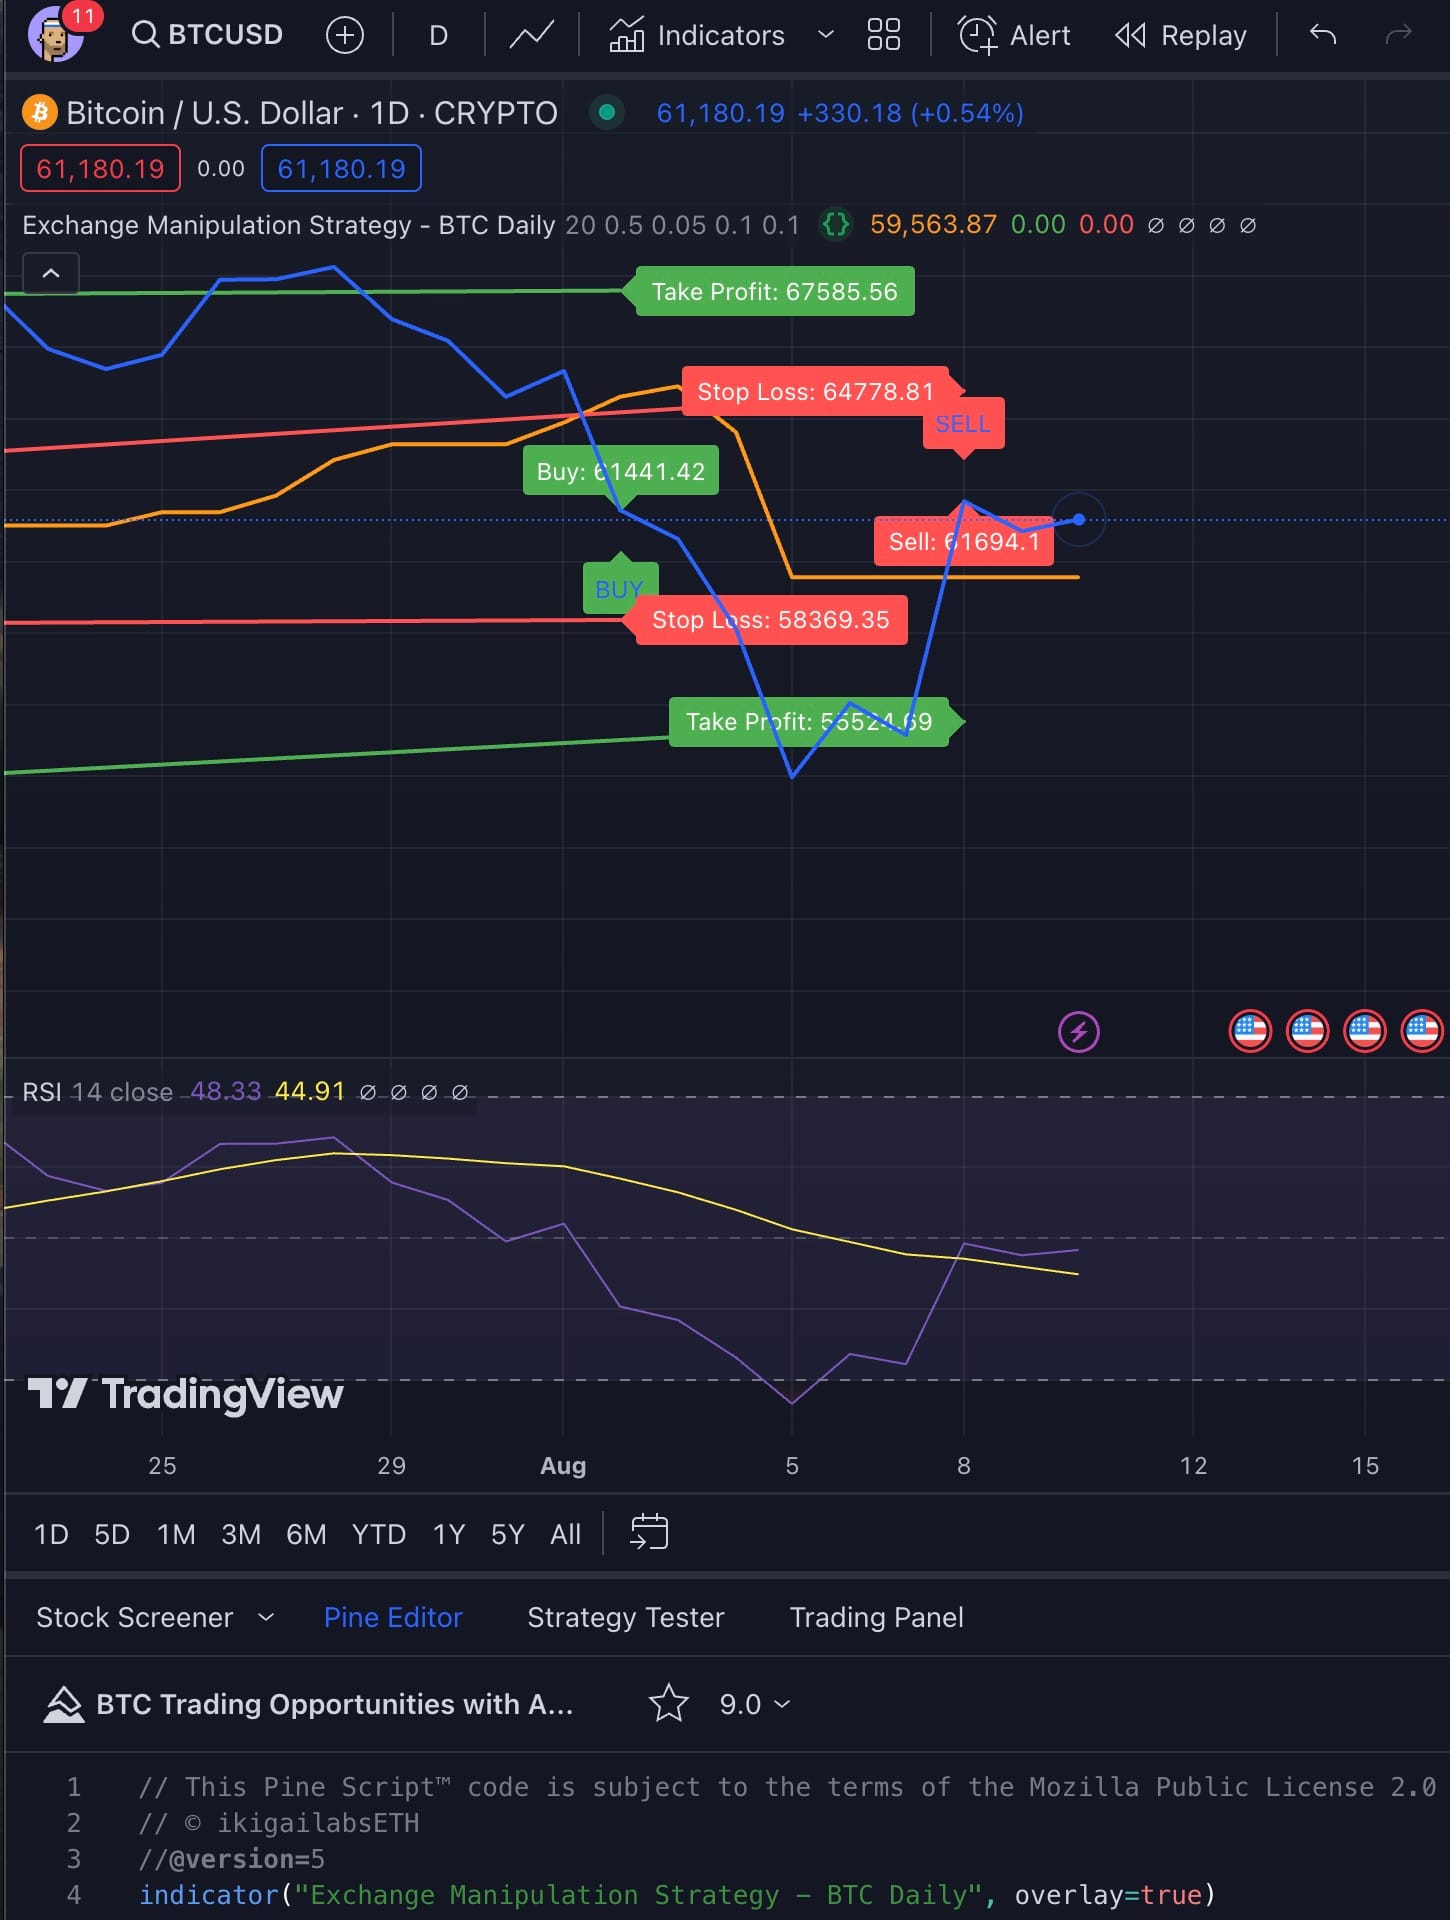
Detect the bullish and bearish oscillations. Recognize when the exchange might "flush" the price to the Fibonacci 0.5 level. Clearly indicate potential buy/sell points, stop loss, and take profit levels based on the described strategy. Acknowledge the exchange's strategy by looking for conditions that might indicate a strategic distribution (e.g., large candles or quick reversals).
Refactored Pine Script

How to Use:
Apply this script on a daily chart to identify potential bullish or bearish flush points, as described by the market dynamics influenced by exchanges. The labeled prices and plotted levels should now provide you with clear entry, stop loss, and take profit points directly on the chart, making your trades precise.
